3.4.1 Using the Panel
This page is for anyone who signs in to watch meters. You do not need admin rights for Monitor, Alarms (view), Diagnostics, or Account.
The app is a progressive web app (PWA). You can add it to a phone home screen. After a software update, do a hard refresh (or close and reopen the tab) so the browser picks up new JavaScript.
Sign In
- Open the site. You land on Login if you have no session
- Enter username (not email) and password
- Submit. A session token is stored in the browser and sent with API requests
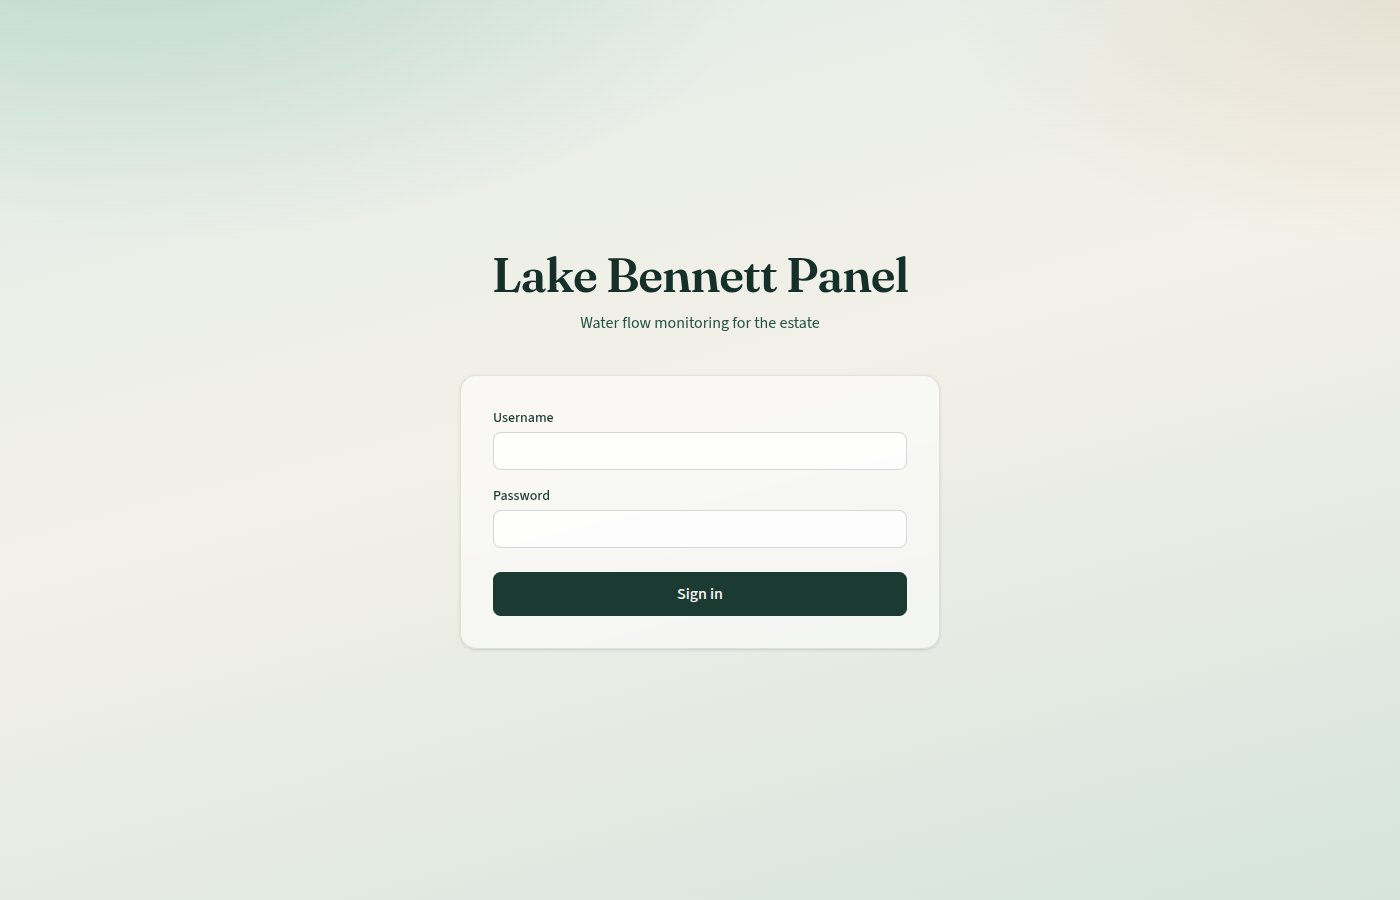
Invalid credentials show an error on the username field. An expired session returns you to Login.
Sign out with Sign out in the top bar. That ends the current session on the server and clears the browser session.
Top Navigation
Always visible after login:
| Link | Who Sees It |
|---|---|
| Lake Bennett Panel (logo) / Monitor | Everyone |
| Alarms | Everyone |
| Diagnostics | Everyone |
| Devices | Admins only |
| Account | Everyone |
| Sign out | Everyone |
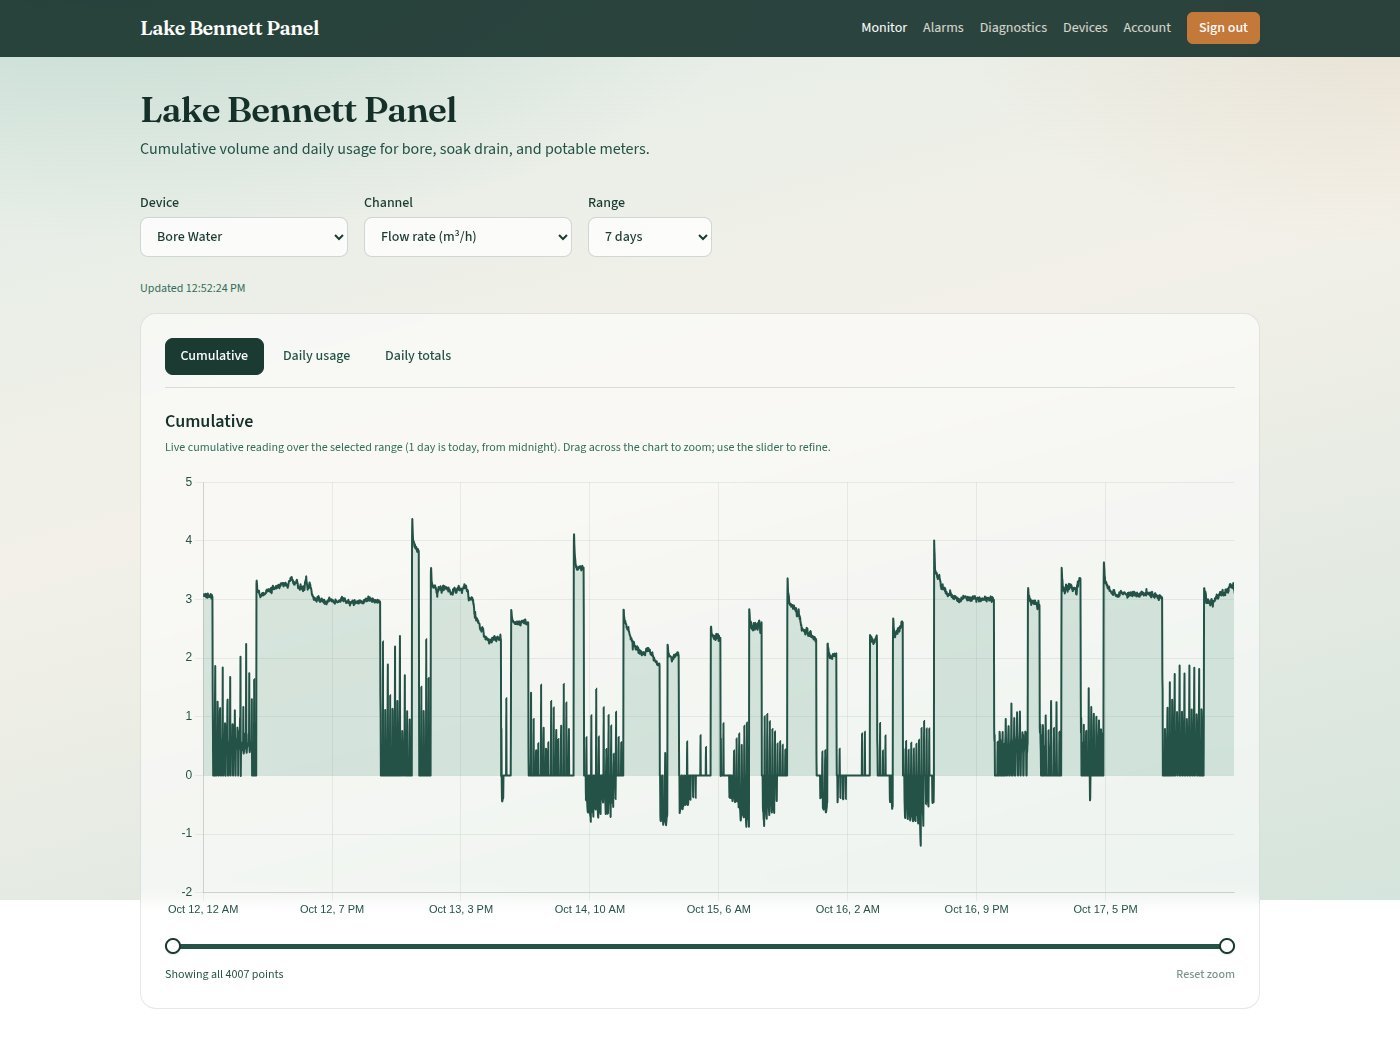
Monitor
Monitor is the home page. It shows one device and one channel at a time.
Controls
| Control | What It Does |
|---|---|
| Device | Which meter (for example Bore Water, Soak Drain, Potable Water) |
| Channel | Which register on that meter. Disabled channels are omitted. Typical live channels: Positive total (litres, cumulative) and Flow rate (m³/h) |
| Range | How much history to load. Windows are local calendar days, not a rolling 24×N hours |
Range meanings (viewer’s timezone, from local midnight):
| Option | Window |
|---|---|
| 1 day (today) | Today, midnight → now |
| 7 days | Today plus the previous 6 calendar days |
| 30 / 90 days | Today plus the previous 29 / 89 calendar days |
| 1 year / 2 years | From the same calendar date last year / two years ago, at local midnight, through now |
That is why today on the 1-day chart matches the last day of the 7-day chart. A rolling “last 24 hours” would still include yesterday afternoon and would not line up.
The page refreshes quietly about every 15 seconds while the tab is visible.
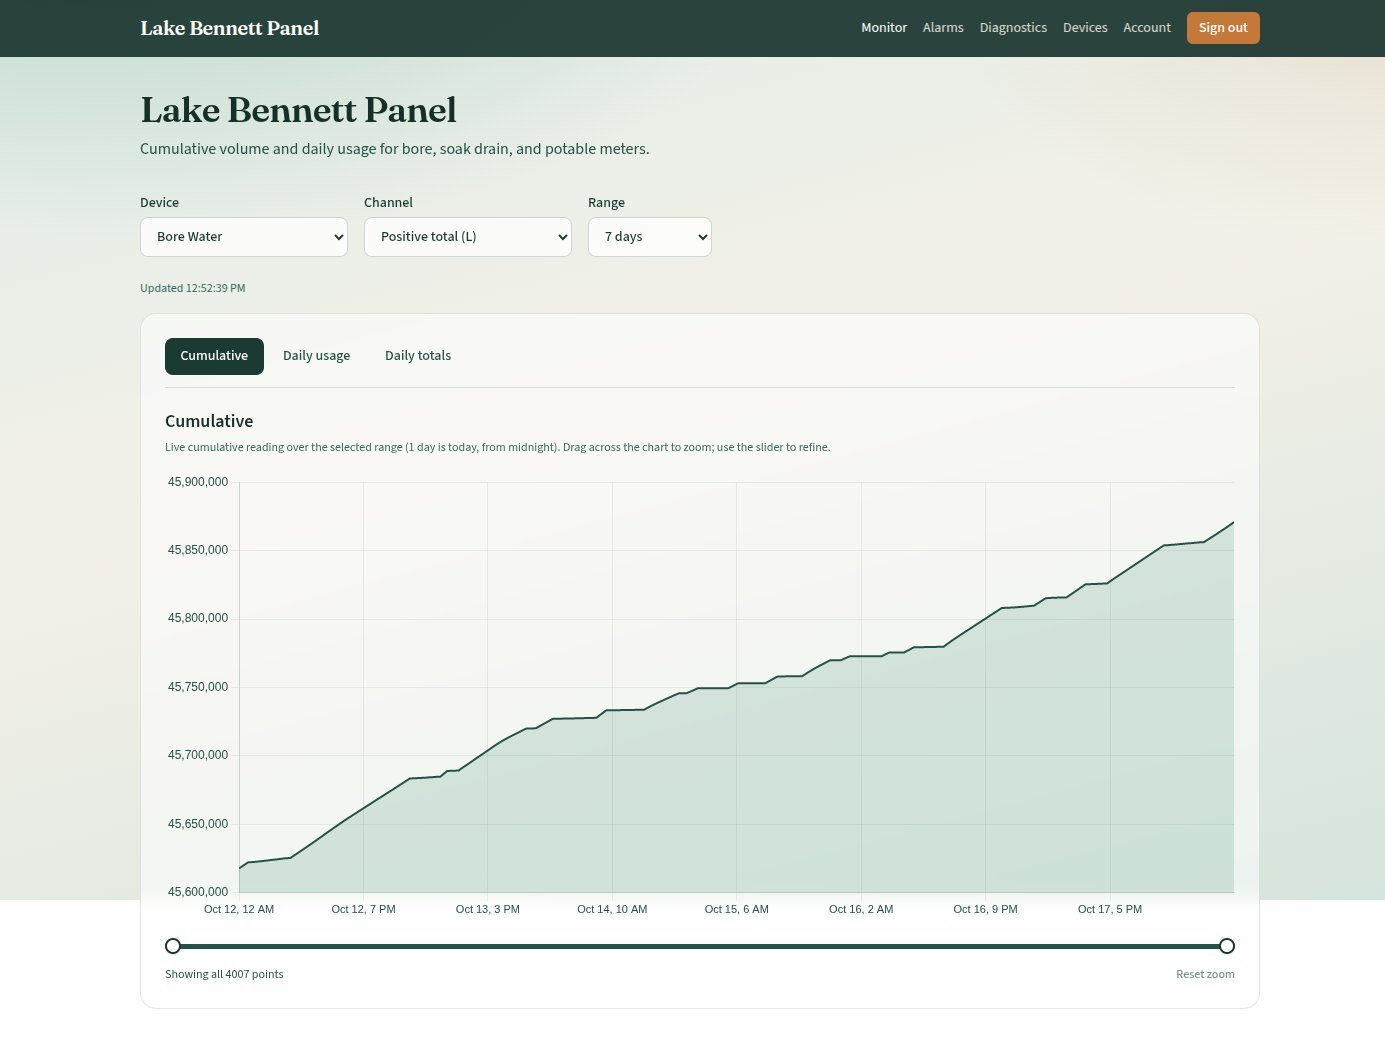
Cumulative Tab
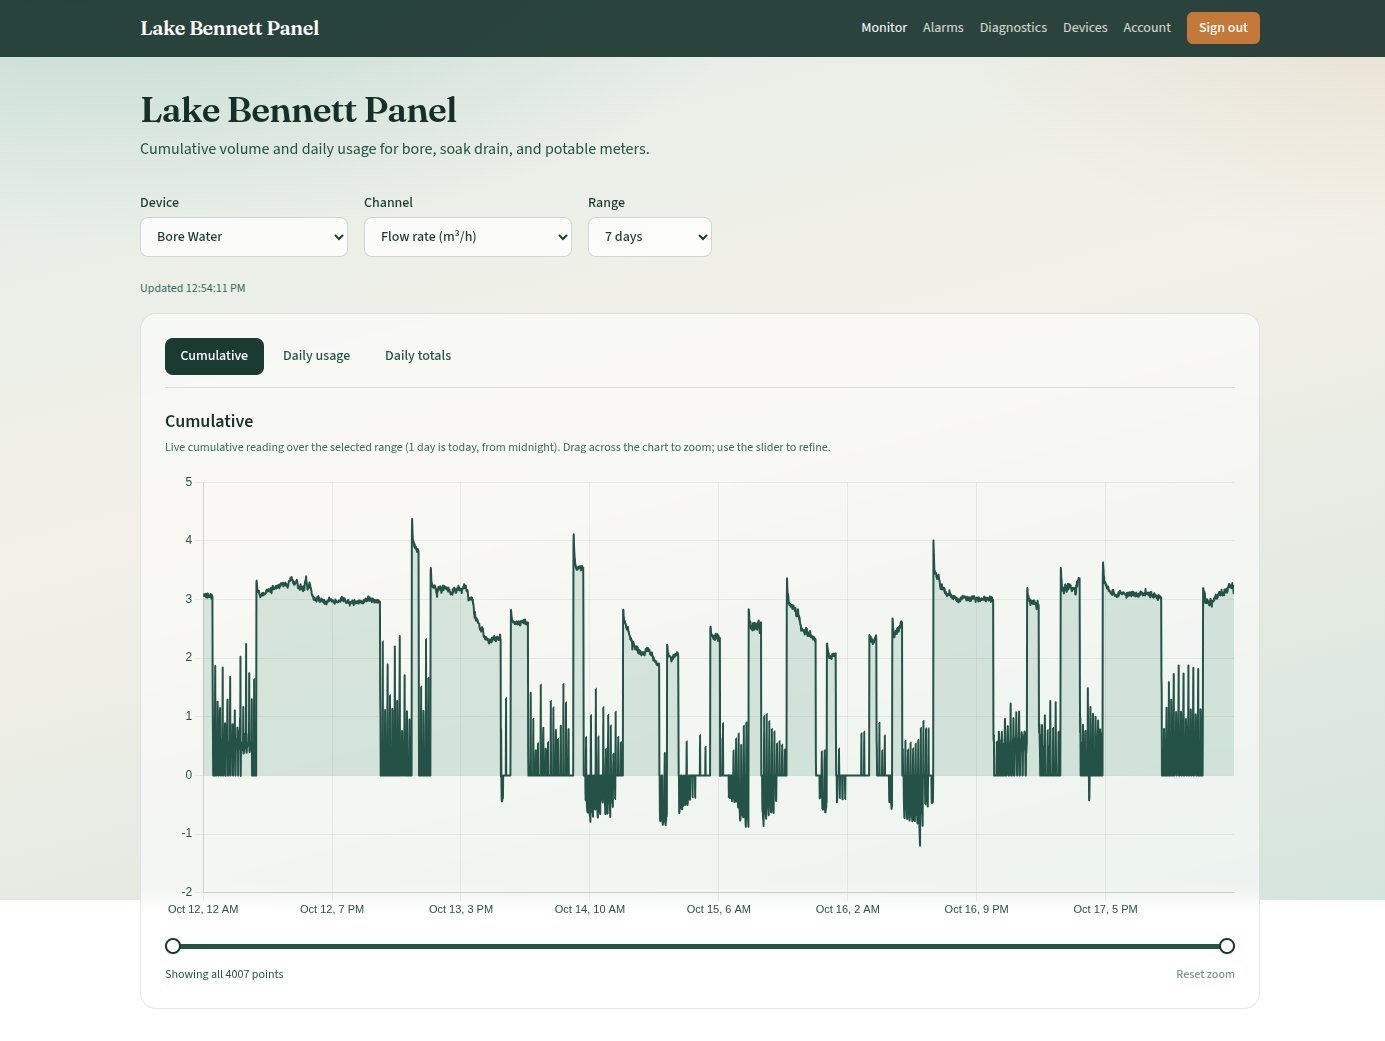
Line chart of the raw (or downsampled) reading over the selected range. For Positive total this is the meter’s running litre count, not daily usage.
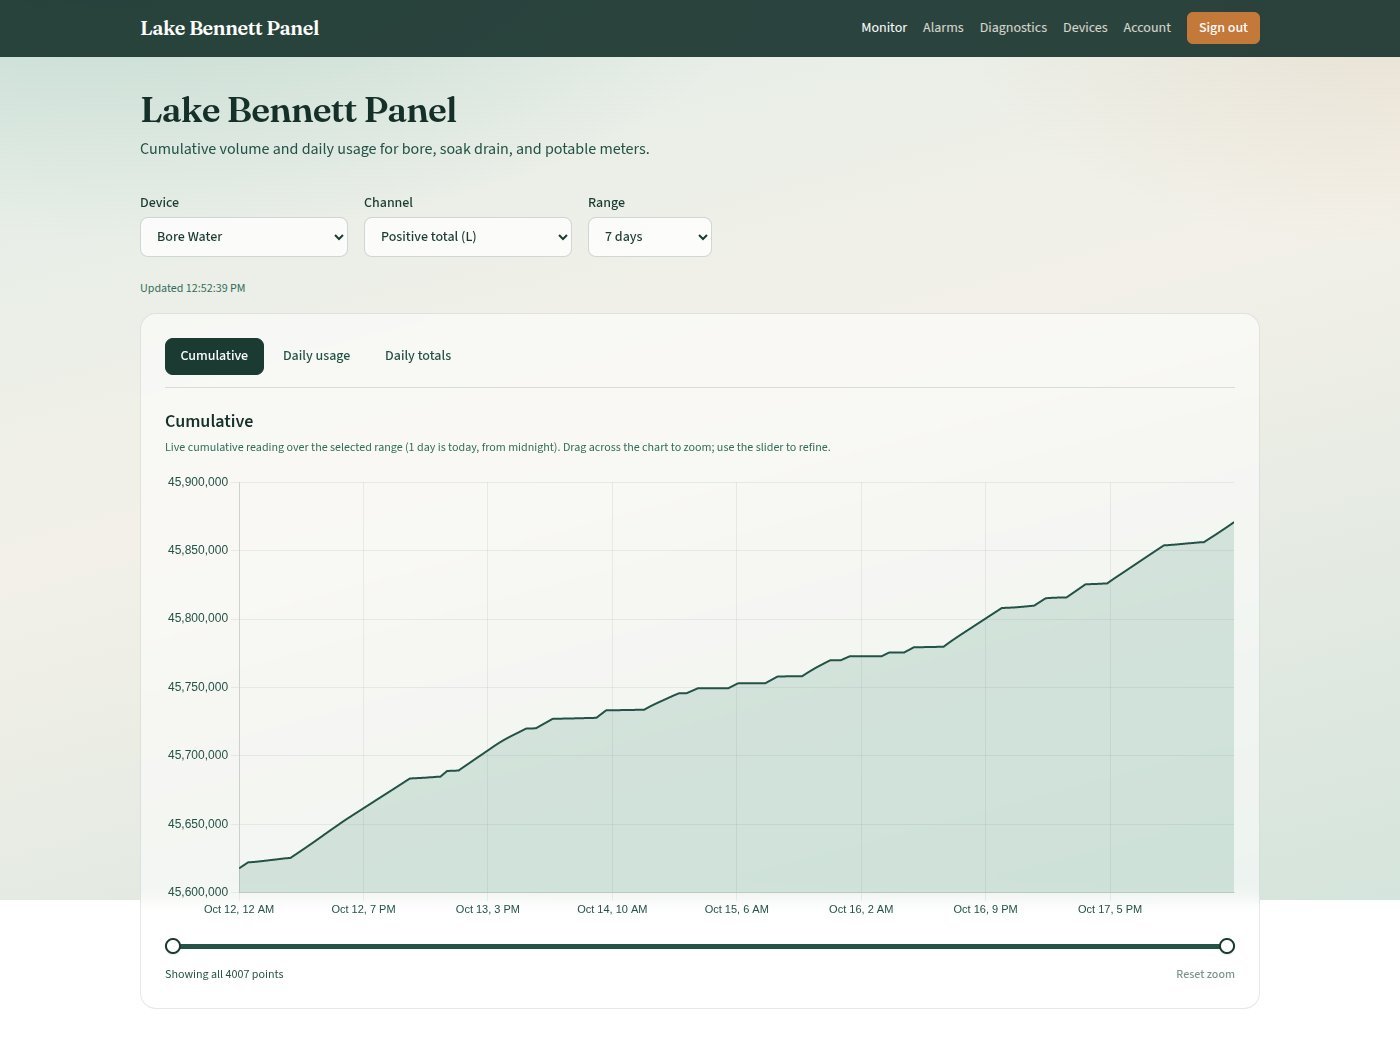
- Tooltip: Exact local date/time and value
- Drag horizontally: On the plot area — zoom into that slice of already-loaded points
- Slider: Under the chart — refine start/end. Reset zoom restores the full loaded range
Long ranges (roughly 7 days and up) are downsampled so the browser is not asked to draw hundreds of thousands of points. Each bucket keeps the last real sample in that slice, so the latest value still matches the 1-day chart. Daily totals are not computed from the downsampled line; they are aggregated from all samples in each local calendar day.
For “is it pumping now”, switch Channel to Flow rate:
Daily Usage Tab
Bar chart of increment per local calendar day: max reading minus min reading that day (midnight to midnight in your timezone).
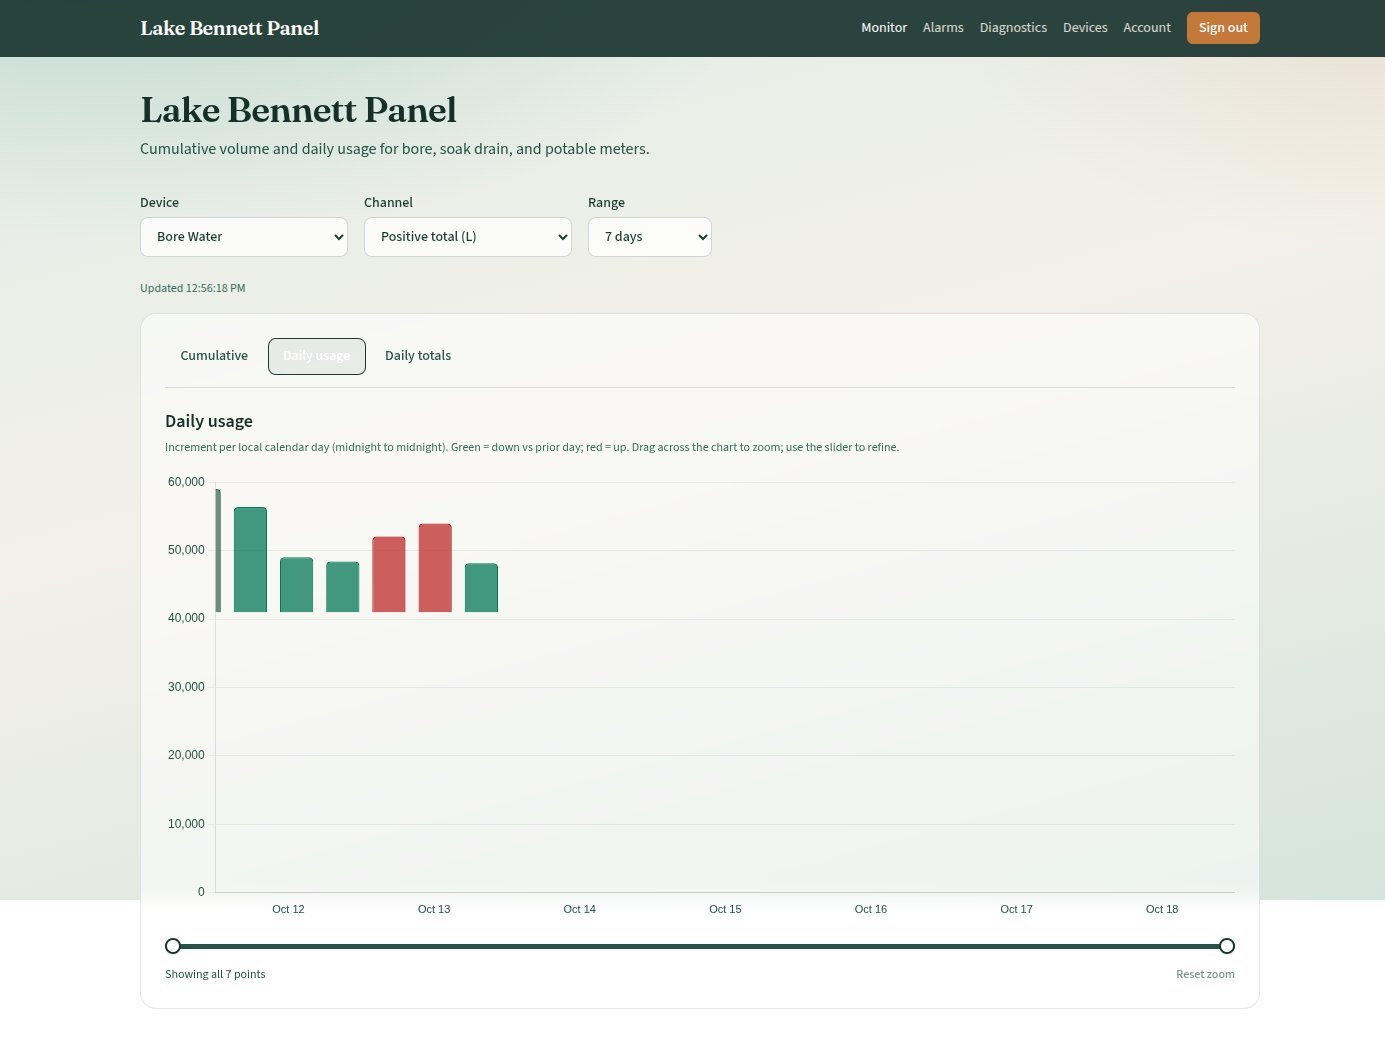
- Green bar: Less than the previous day
- Red bar: More than the previous day
- Neutral: Same as the previous day
Same drag-to-zoom and slider as the line chart.
Use this for Positive total. A flow-rate channel’s “increment” (max − min of rate) is usually not a useful daily volume.
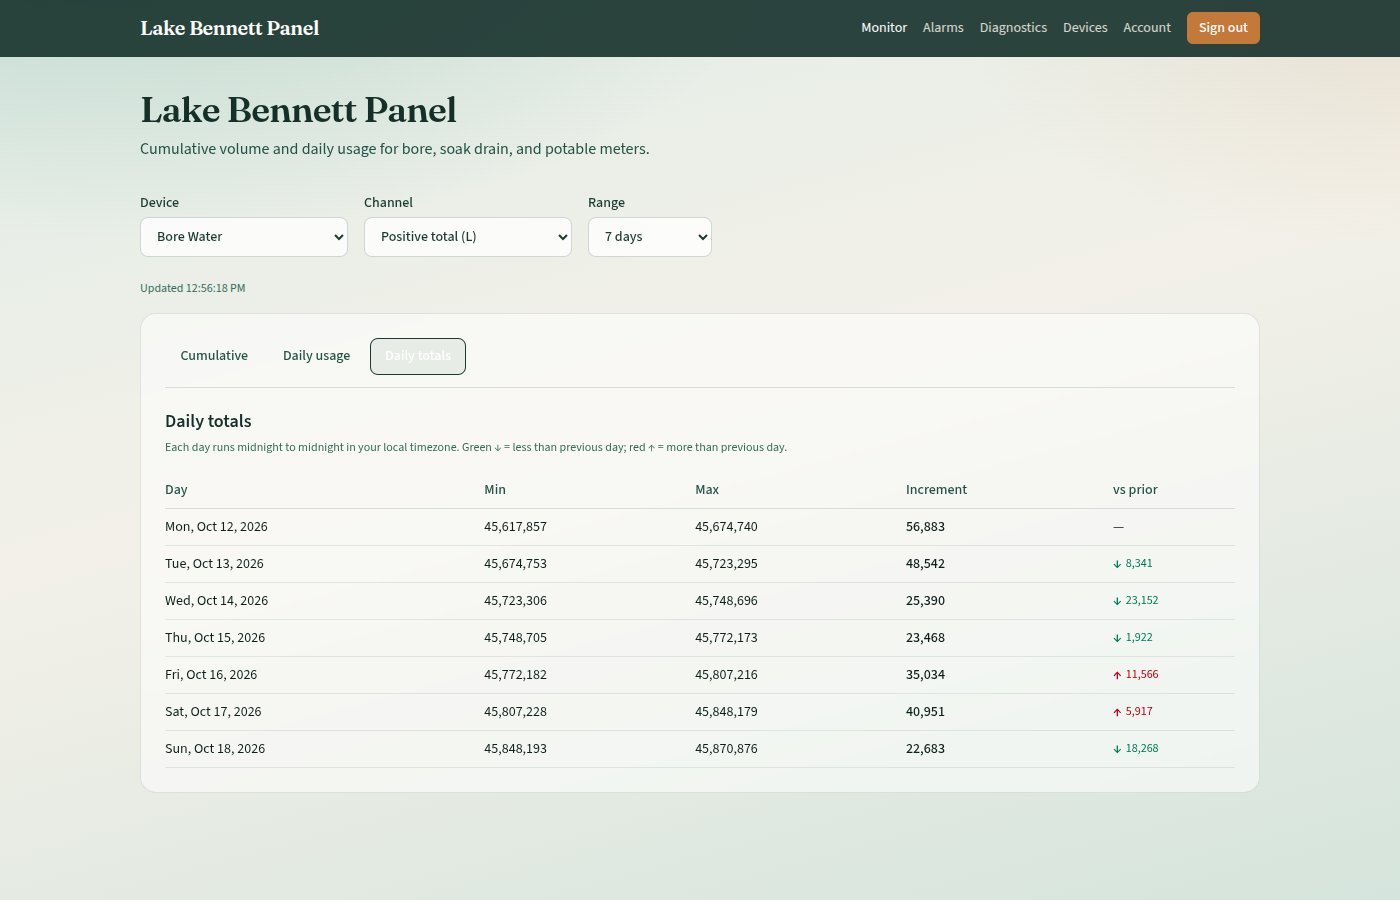
Daily Totals Tab
The same daily min / max / increment as the bar chart, as a table, with up/down vs the prior day.
Empty and Loading States
- First load: Shows a progress panel (“Fetching readings…”)
- Range change: Changing device, channel, or range cancels the previous request so a slow 2-year fetch does not overwrite a later 1-day result
- No readings in this range: No points for that device/channel/window (meter offline, channel disabled, or clock/window issue)
Account (Non-Admin)
On Account:
- Profile: Optional email (used as contact on the account; login is still username)
- Password: Current password plus new password (minimum 8 characters, confirmed)
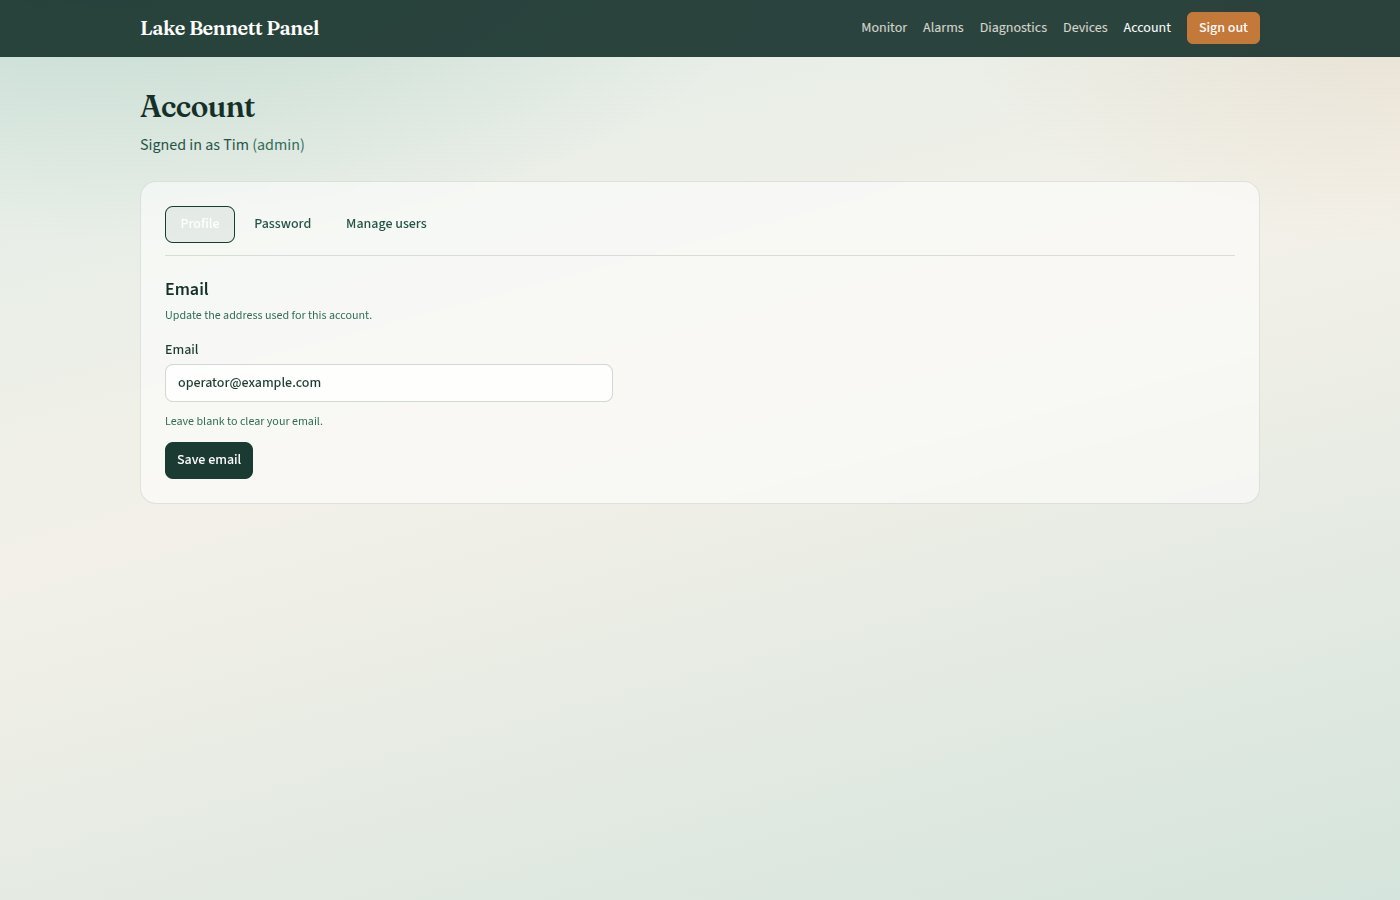
Admins also see Manage users; see 3.4.2 Accounts and Users.
Practical Tips
Monitor Habits
Prefer Positive total on Monitor for estate water use; Flow rate is better for “is it pumping now” and for drop (air-suck) alarms. Compare 1 day vs 7 day on the same channel — different channels have different units and magnitudes. If charts look stale after a release, hard-refresh. Charts store times in UTC and convert to your browser timezone for ticks and daily buckets.
Version Control
| Version | Date | Description |
|---|---|---|
| 1.0 | 2026-10-18 | Initial Release |
| 1.1 | 2026-10-20 | Style guide compliance — list labels and tip admonition |
Next Review Date: 2027-04-20